Causal Inference for Policy Evaluation
Overview
Policy evaluation asks whether a program, regulation, or intervention actually changed the outcomes it was designed to change, and by how much. Answering that question means comparing what happened with what would have happened without the policy: a counterfactual we never observe directly.
These open lecture notes cover the modern toolkit for that comparison. It starts from the potential outcomes framework and randomized experiments, including what goes wrong in real experiments (non-compliance, attrition, spillovers). It then works through designs in which the researcher does not control assignment: instrumental variables, regression discontinuity, panel methods (fixed effects, difference-in-differences, synthetic control), and regression and matching, before closing with how to combine designs and evidence. Each chapter is available as a web page and as in-class slides, with worked R code and case studies from published research.
Who These Notes Are For
These notes are for analysts who evaluate policies and business decisions in government, insurance, banking, and industry, and for graduate students in business and economics who are learning to do so.
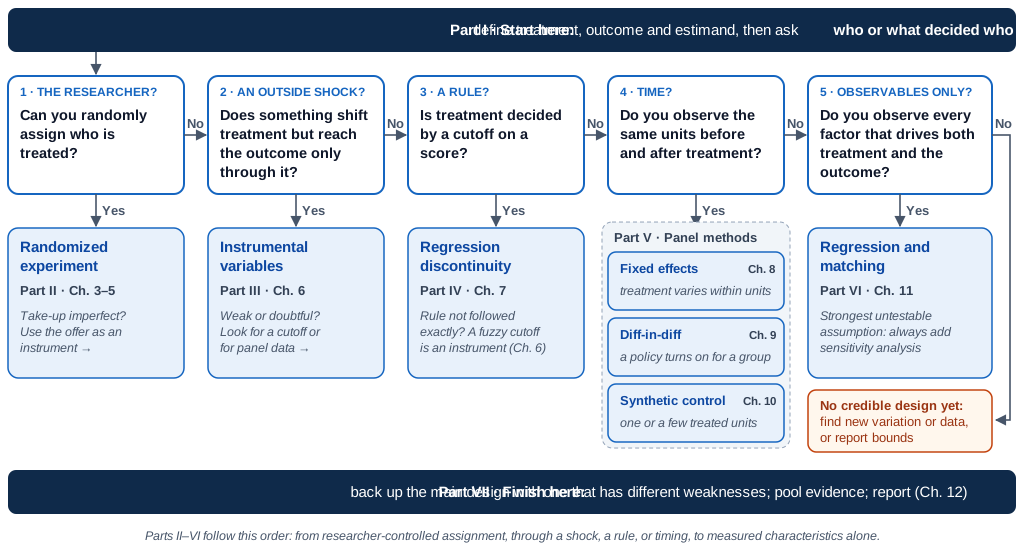
The chapters follow the way an evaluation is planned. Each part starts from how treatment was assigned, and the flowchart below points to the relevant chapter. Each method chapter opens with a one-page summary for practitioners: when the method applies, the data it needs, the assumption it rests on, the checks to run, the R code, and how to explain the result to a manager. The methods are then applied to recent studies from leading journals in economics, finance, insurance, information systems, and operations management, several of them on generative AI at work, and each case study ends with the practices worth reusing. Simulations with a known true effect show what each method recovers, and three chapters repeat the analysis on real public data. Derivations are kept short in the main text, with fuller versions in optional sections.
How the Notes Are Organized
The notes are organized around one question: who or what decided who was treated? Each part covers a different answer, moving from designs where the researcher controls assignment, through designs that exploit a known source of variation (a shock, a rule, timing), to designs that rely only on measured characteristics.
Methods at a Glance
Every method below answers the same question: what would have happened without the policy? They differ in which assumption does the work, and in whose effect they recover.
| Method | Core idea | Key identifying assumption | What it estimates | Main limitations | Chapters |
|---|---|---|---|---|---|
| Randomized controlled trial (RCT) | Researcher randomly assigns treatment, so treated and control groups are comparable on everything, observed or not | Random assignment; excludability; no interference between units | Average treatment effect (ATE), or intent-to-treat (ITT) effect | Costly, sometimes unethical or infeasible; external validity; non-compliance, attrition and spillovers can break the design | 3–5 |
| Instrumental variables (IV) | Use a variable that shifts treatment but affects the outcome only through treatment | Instrument relevance; exclusion restriction; independence; monotonicity (no defiers) | Local average treatment effect (LATE) for compliers | Exclusion restriction is untestable; weak instruments; LATE may not generalize beyond compliers | 6 |
| Regression discontinuity (RDD) | Compare units just above and just below a cutoff that determines treatment | Potential outcomes continuous at the cutoff; no precise manipulation of the running variable | Effect for units at the cutoff | Local to the cutoff; needs many observations near it; sensitive to bandwidth and functional form | 7 |
| Panel data / fixed effects | Compare each unit with itself over time | Strict exogeneity: no time-varying confounders and no feedback from past outcomes | Variance-weighted average of within-unit effects | Time-varying confounders remain; measurement error amplified; needs within-unit variation; cannot estimate effects of time-invariant traits | 8 |
| Difference-in-differences (DiD) | Compare the change over time in treated units with the change in untreated units | Parallel trends in the absence of treatment; no anticipation | Average treatment effect on the treated (ATT) | Parallel trends untestable after treatment; two-way FE biased with staggered adoption and heterogeneous effects; serially correlated errors | 9 |
| Synthetic control | Build a weighted combination of untreated units that tracks the treated unit before treatment | Pre-treatment fit carries over to the post-treatment counterfactual; no spillovers to donor units | Effect for one or a few treated units, over time | Needs a long pre-treatment period and good fit; few treated units; inference relies on placebo/permutation tests | 10 |
| Regression / covariate adjustment | Compare treated and untreated units with the same observed characteristics | Selection on observables (no unmeasured confounders); correct functional form | A weighted average of effects across covariate values (the ATE if effects are constant or the model is fully interacted) | Cannot handle unobserved confounders; extrapolates where groups do not overlap | 3, 11 |
| Matching / propensity scores | Pair each treated unit with similar untreated units, or reweight by the probability of treatment | Selection on observables; overlap (common support) | ATT or ATE | Same blind spot for unobservables as regression; poor overlap; results sensitive to specification | 11 |
Lectures
Part I: Foundations
- Chapter 1: Introduction to Policy Evaluation and Causal Inference
- Chapter 2: Causal Inference Framework
Part II: Randomized Experiments
- Chapter 3: Randomized Experiments: Design and Inference
- Chapter 4: Experiments in Practice
- Chapter 5: When Experiments Go Wrong
Part III: Instrumental Variables
- Chapter 6: Instrumental Variables
Part IV: Regression Discontinuity
- Chapter 7: Regression Discontinuity Design
Part V: Panel Methods
- Chapter 8: Panel Data and Fixed Effects
- Chapter 9: Difference-in-Differences
- Chapter 10: Synthetic Control
Part VI: Selection on Observables
- Chapter 11: Regression and Matching
Part VII: Synthesis
- Chapter 12: Putting It Together: Combining Designs, Accumulating Evidence, and Reporting
About the Author

Dr. Fei Huang
Dr. Fei Huang is an Associate Professor in Risk and Actuarial Studies at UNSW Business School. Her research and teaching focus on responsible AI, insurance, and data-driven decision-making that is accurate, interpretable, and equitable.
License
Materials created for this resource are licensed under the Attribution-NonCommercial-NoDerivatives 4.0 International (CC BY-NC-ND 4.0) license unless otherwise noted.
This license doesn’t permit public redistribution of adapted versions. If you’d like to adapt this content for your own non-commercial course, please get in touch at feihuang@unsw.edu.au to discuss.
How to cite
Huang, F. (2026). Causal Inference for Policy Evaluation [Lecture notes]. UNSW Sydney.
To cite these notes, please use this BibTeX entry:
@misc{huang2026causalpolicy,
  author    = {Huang, Fei},
  title     = {Causal Inference for Policy Evaluation},
  publisher = {UNSW Sydney},
  note      = {Lecture notes},
  year      = {2026}
}
Acknowledgement
I would like to acknowledge Dr. Patrick Laub, whose Quarto website templates supported the development of this site.
Development note
This project was developed with support from AI coding assistants. All analysis, content decisions, and conclusions are the author’s own and her responsibility.